What information do you need for a scan?
Required:
Area at risk: begin your scan by selecting one or more geographic areas (from countries and territories or the states and provinces used in Compendium data). Regional economic communities (RECs) and regional plant protection organizations (RPPOs) can also be selected. Species in the scan results are not recorded as present (or are recorded as ‘absent’) in the ‘area at risk’.
Source areas: multiple selections of geographic areas can be made. Species in the scan results are recorded as ‘present’ in one or more ‘source areas’. Assistance is provided to select neighbouring geographic areas (by land border), trade partners, and geographic areas with matching climates; other 'source areas’ may also be chosen manually and this is useful in the case of known trade or transport links. Records of presence include ‘present’ (with no further details), ‘widespread’, ‘localized’, ‘present, few occurrences’ and ‘transient’ from the Compendium datasheets.
Optional filters:
Datasheet filters: three filters based on CABI Compendium datasheet types are provided.
Only show enhanced datasheets: these datasheets have been authored by one or more species experts and peer reviewed. The remainder are basic datasheets which may contain information from data mining that has not been reviewed by an expert.
Only show plant pests: this will restrict your results to plant pest datasheets.
Only show known invasive species: this will restrict the results to invasive species datasheets. Note that this will exclude pests that have not been recorded as invasive species in CABI Compendium
Pathways: the pathway of introduction - the physical means by which the species can be transported (as a ‘stowaway’, ‘contaminant’, or ‘unaided’).
Habitats: the habitat(s) where the species has been recorded (‘terrestrial – managed’, ‘terrestrial - natural/semi-natural’, ‘littoral’, ‘marine’, ‘freshwater’, ‘brackish’, ‘other’).
Impact outcomes: datasheet authors have selected relevant impact categories from a set of 32 options which can be viewed in the datasheets under the heading Risk and Impact Factors.
Organism type: this uses broad taxonomic groups (‘bacteria’, ‘fungi/Chromista’, ‘invertebrates’, ‘plants’, ‘protozoa’, ‘vertebrates’ and ‘viruses’). Further taxonomic levels (to family) are available in the download of the scan results.
Note: data on Pathways, Habitats and Impact outcomes are not yet available for many species so when selected as a filter in the scan, the system is set to automatically include species for which there is no information as well as those that meet the selected filter criteria with a positive value. Only species with a negative value will be excluded by default. The scan results page and download files indicate the sections that are missing for those species because these may require further investigation. This setting can be changed to exclude species with missing data from the scan results if you prefer. CABI is working to fill these data gaps.
Additional filters in the premium version of the Horizon Scanning Tool:
Plant hosts: one or more plant hosts may be selected using the scientific or common name. Plants classified as main, secondary and wild hosts of a plant pest are included but there is an option to restrict the search to main hosts only. This means that only those pests which are reported to cause major damage on those hosts will be displayed.
Plant parts in trade: the plant parts liable to carry a pest in trade or transport. This is another filter for which data are currently unavailable for all species and, as for Pathways and Habitats above, species that cannot be excluded from the scan results on this basis are indicated.
Note: the geographic area search and plant host search are independent, i.e. a search of pests from Kenya with tomato selected as a host will include species which occur in Kenya and attack tomatoes, but specific evidence that the pests attack tomatoes in Kenya has not been compiled. In a similar way, the plant parts filter is independent of plant host.
How does the trade partner feature work?
The Horizon Scanning Tool will present two lists of trade partners from which the ‘area at risk’ imports goods. The first list considers trade of all commodities and could be used as a general indicator of links between partners. The second list only considers trade of imported animal and plant commodities and so represents a more focused list of partners which could be a potential source of new pests and diseases through imports. The lists are ordered by the total value (in USD) of trade imports.
The data used for this feature comes from the UN’s Comtrade database. Comtrade is built from the latest published import and export statistics from national governments and in most cases is taken from 2016 and 2017 data. https://comtrade.un.org/
How does the climate matching work?
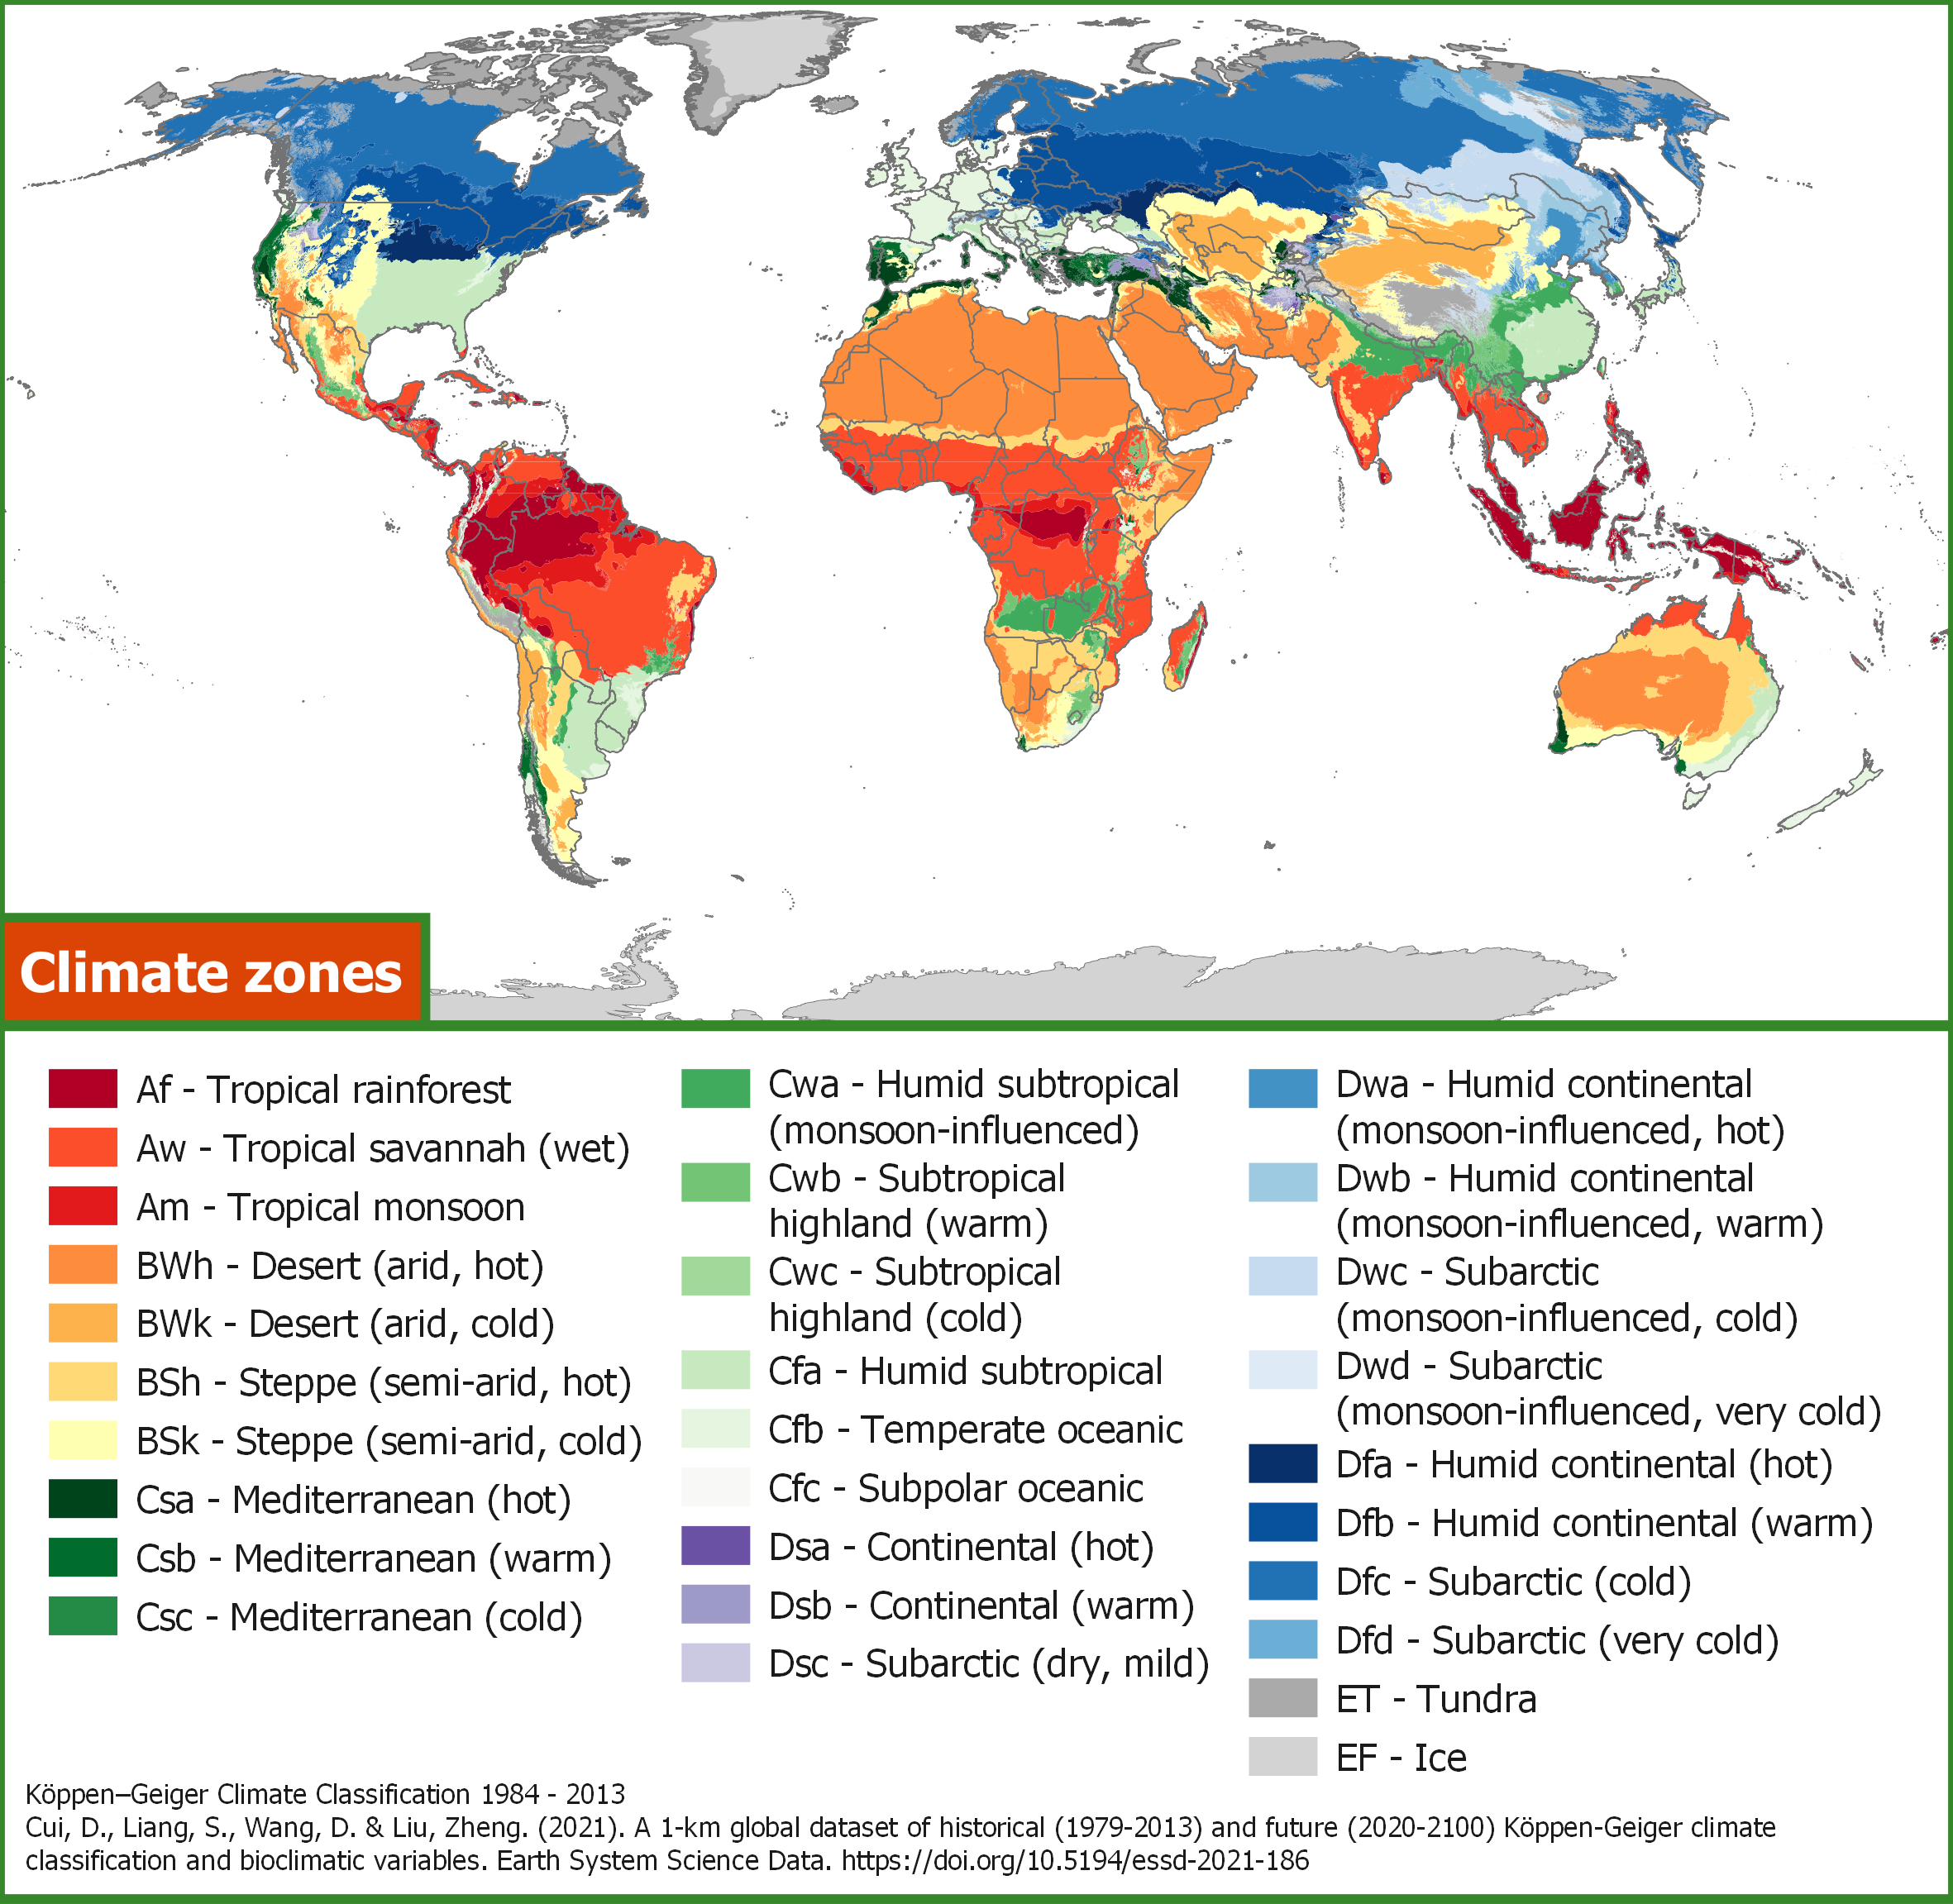
The Köppen-Geiger climate classification scheme provides an ecologically meaningful way to characterize climatic conditions. It has been widely applied in risk assessments addressing the likelihood of species establishment in new areas and also in climate change studies. In the scheme, the world’s climate zones are divided into 31 different types. There are five main climate groups; A (tropical), B (dry), C (temperate), D (continental), and E (polar). Further sub-divisions are derived where the second letter indicates the seasonal precipitation type, while the third letter indicates the level of heat.
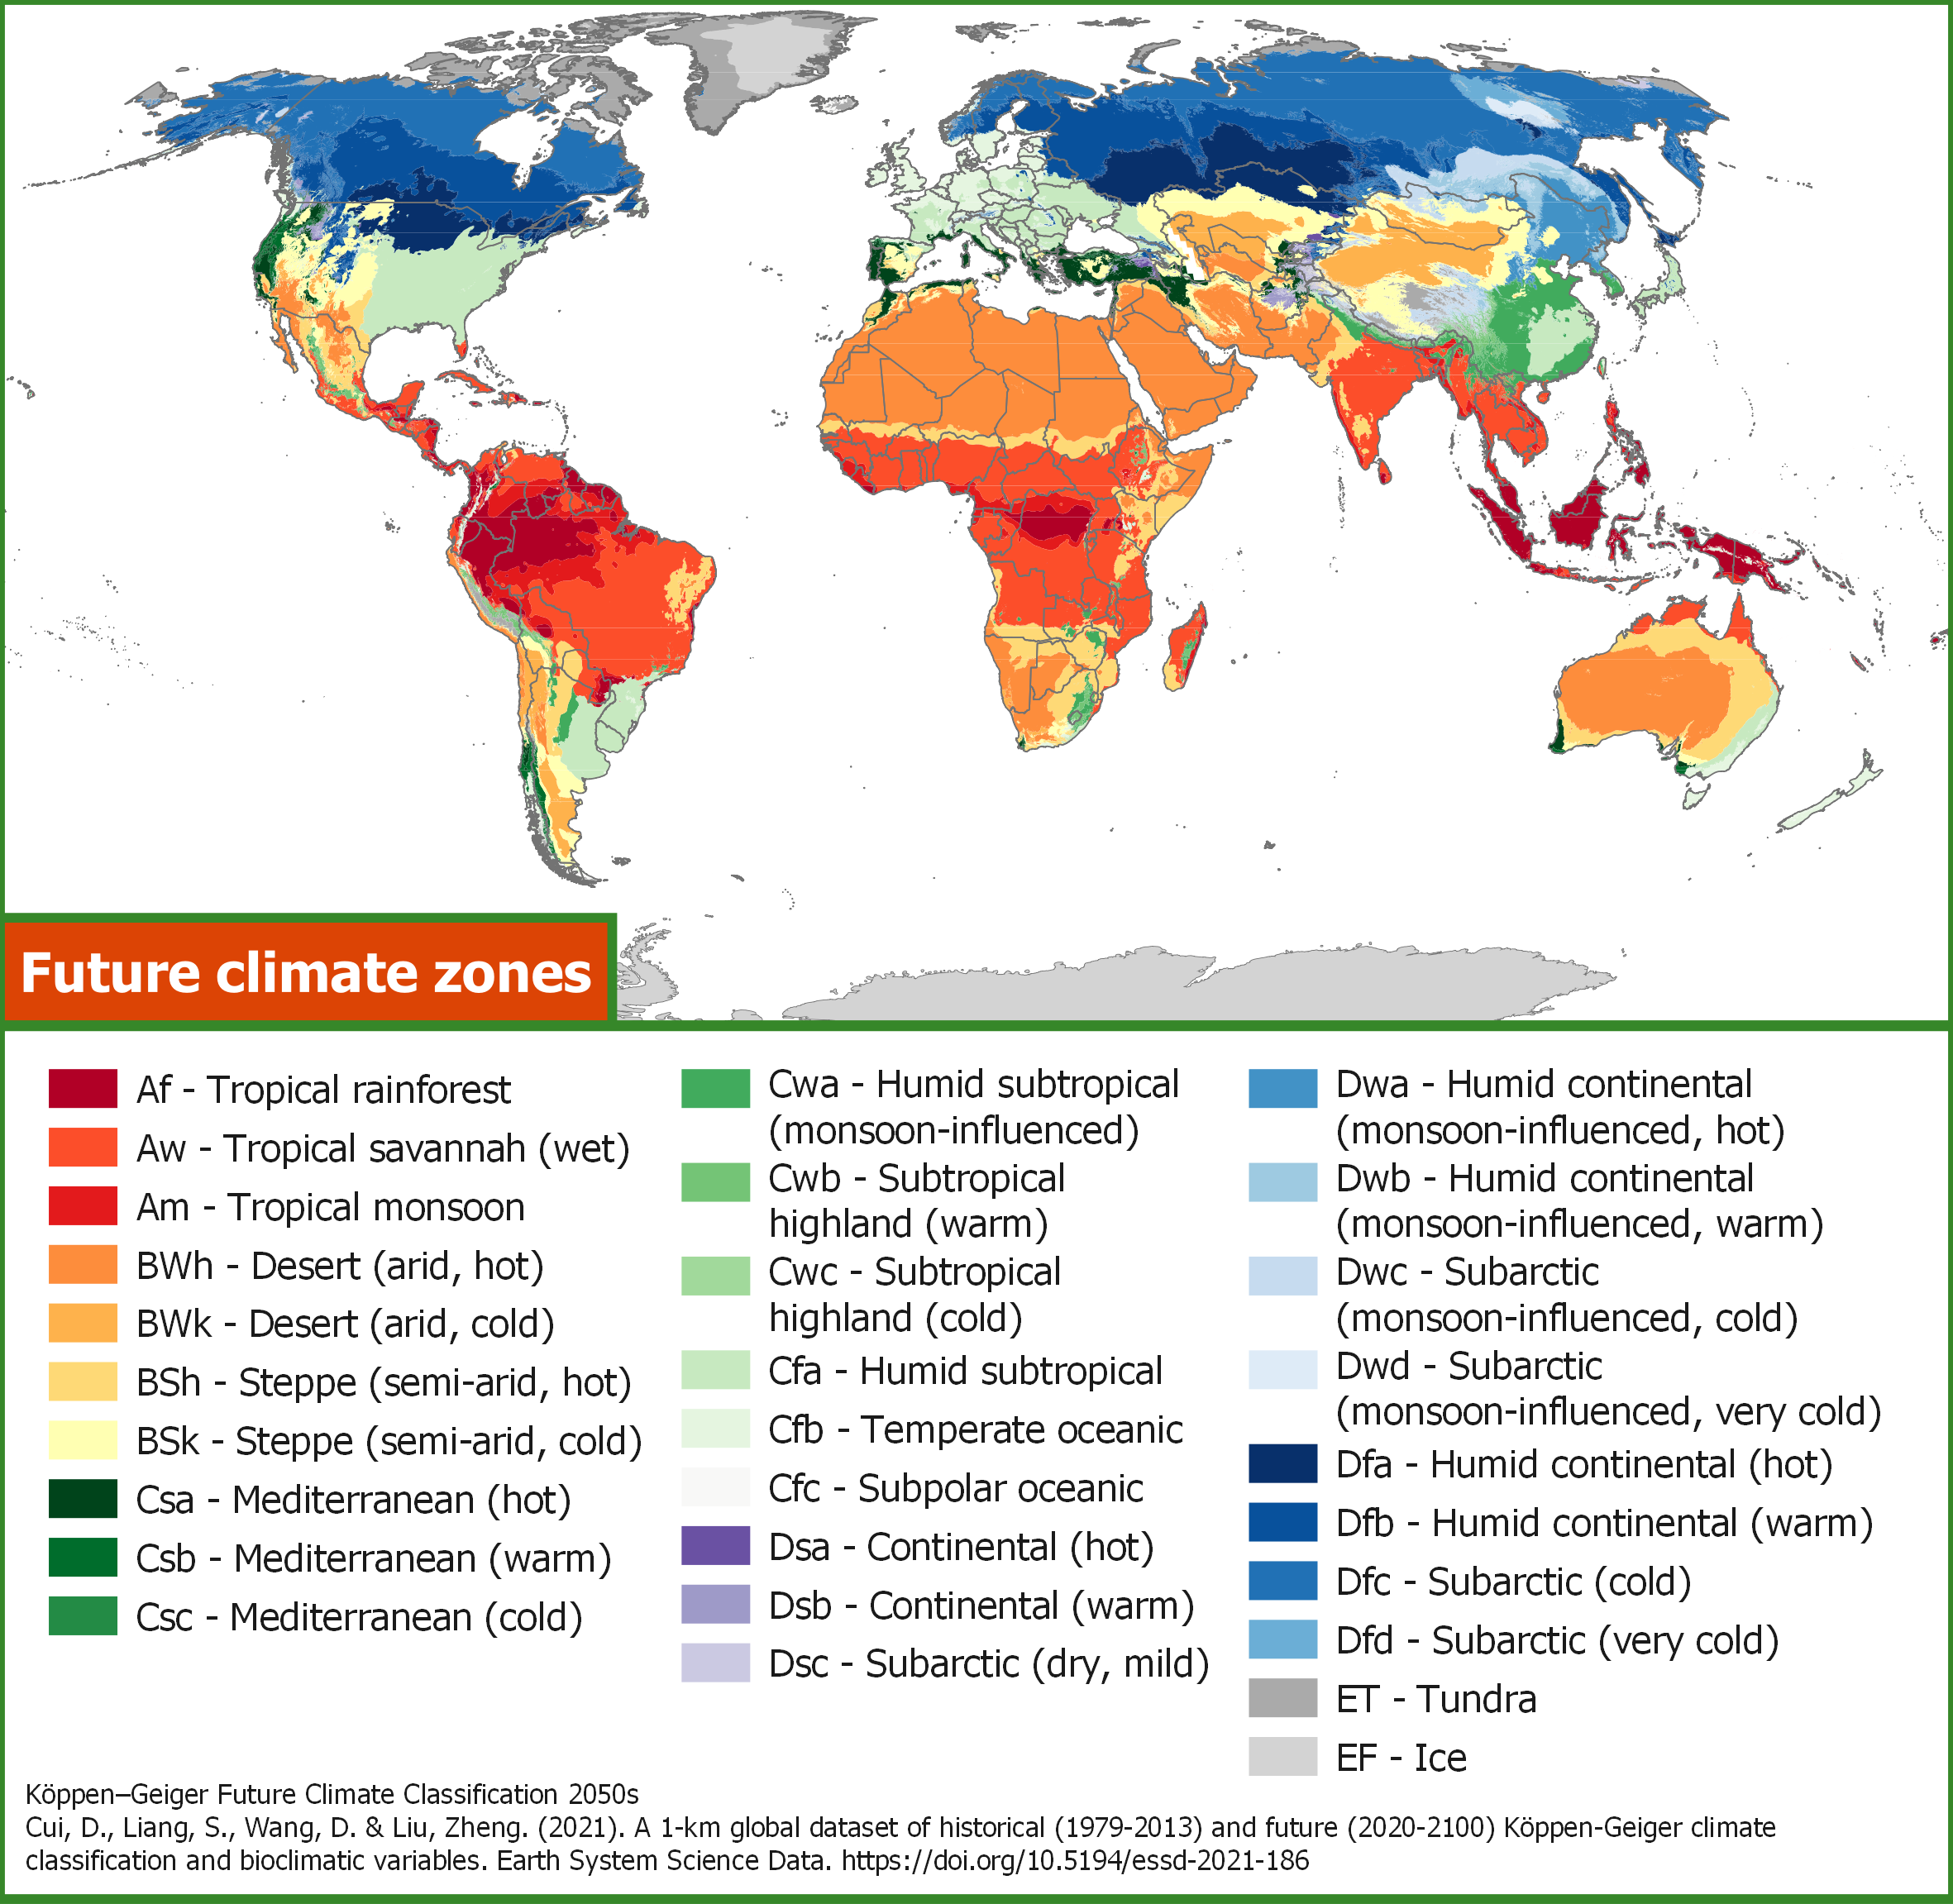
There are many studies providing distributions of the current and future K-G climate zones. The Horizon Scanning Tool uses data from the KGClim project* to assign climate zones to Compendium geographic areas. The current climate zones are based on historical data from 1984-2013 and the future zones are based on the projected climate scenario RCP 8.5 and modelled climate data for 2040-2069 (indicated as 2050s in the tool).
Details of the KGClim project can be found in Cui D, Liang S, Wang D, Liu Zheng 2021. A 1-km global dataset of historical (1979-2013) and future (2020-2100) Köppen-Geiger climate classification and bioclimatic variables. Earth System Science Data. https://doi.org/10.5194/essd-2021-186.
*The K-G zone dataset used in the tool was changed in November 2023 when the climate change feature was added. This means that the areas matched by current climate before and after this date are not exactly the same and cannot be directly compared.

When an ‘area at risk’ is selected and the scan is initiated, all the different climate zones currently found within the ‘area at risk’ are listed. Any additional future climates zones from the 2050s projection for the ‘area at risk’ are also shown. It is possible to select all or some of these climate zones. As this is done, ‘source areas’ with matching climate zones, based on their current K-G zone distribution, are listed on the right-hand side of the ‘Submit scan’ selection box.
This functionality enables a global scan to be run to include invasive species and plant pests that are not recorded as present in the ‘area at risk’ but are present in areas with similar climatic zones, now or in the future.
What information is included in the download file?
The scan results generated by the tool can be exported to a CSV or Excel file. The download contains additional Compendium information to the results visible in the tool to help prioritize species:
- Preferred scientific name and preferred common name
- Details of datasheet content in CABI Compendium
- Taxonomy (domain, kingdom, phylum, class, order and family)
- An indication of whether the species is known to be invasive, i.e. it has an invasive species datasheet
- The total number of geographic areas with records of presence
- The number of geographic areas with records of presence that neighbour the ‘area at risk’
- The number of geographic areas with records of presence that have matching climates to the current climate zones in the ‘area at risk’
- The number of geographic areas with records of presence that have matching climates to a 2050s projection of climate zones in the ‘area at risk’ after the current climates have been subtracted
- The number of hosts recorded for the species
- URLs to the species datasheets
Note: there is a download limit of 6,500 records
Saving and sharing a scan
Every scan run in the Horizon Scanning Tool generates a unique URL that can be bookmarked,
saved or shared.
What pathway categories do you use in your data?
Pathways of introduction are classified according to Carlton JY, Ruiz GM, 2005. Vector science and integrated vector management in bioinvasion ecology: conceptual frameworks. In: Invasive Alien Species: A New Synthesis (ed. by Mooney HA et al.). Island Press, Washington, USA . In this classification, two sets of categories are used:
Pathway cause: why a species is transported, whether accidentally or deliberately.
Pathway vector: how, physically, a species in transported, that is, the physical means or agent.
The categories described as ‘Pathway vectors’ are used in this Horizon Scanning tool.
It is acknowledged that the scheme now widely accepted by invasive species data publishers is that described in the technical note Convention on Biological Diversity (CBD), 2014. Pathways of introduction of invasive species, their prioritization and management (26 June 2014; https://www.cbd.int/doc/meetings/sbstta/sbstta-18/official/sbstta-18-09-add1-en.pdf) . It is CABI’s intention to apply this more recent schema to the data in CABI Compendium datasheets and the Horizon Scanning Tool. So far the Compendium categories have been grouped under the main headings of this schema.
Habitat data
Citation paper: Saul W, Roy HE, Booy O, Carnevali L, Chen H, Genovesi P, Harrower CA,
Hulme PE, Pagad S, Pergl J, Jeschke JM (2017) Assessing patterns in introduction pathways of alien
species by linking major invasion databases. Journal of Applied Ecology 54(2): 657–669.
https://doi.org/10.1111/1365-2664.12819
Citation data: Saul W, Roy HE, Booy O, Carnevali L, Chen H, Genovesi P, Harrower CA,
Hulme PE, Pagad S, Pergl J, Jeschke JM (2016) Data from: Assessing patterns in introduction pathways of alien
species by linking major invasion databases. Dryad Digital
Contact us
For any questions, feedback or technical problems with the Horizon Scanning Tool please contact us at compend@cabi.org
Or to gain full premium access to the tool by becoming a CABI Compendium Subscriber please speak to our sales team at sales@cabi.org